The ‘Skinny’ on FFMI
FFMI, or Fat Free Mass Index, quantifies the relationship between an individual’s height and lean body mass (muscle, bone, organ, glycogen, connective tissue, etc). While it’s important to acknowledge that lean body mass includes more than just muscle, differences in muscle mass are the primary driver behind lean mass differences for individuals of the same height. Therefore, this makes FFMI a helpful tool in evaluating an individual’s muscle mass relative to their frame.
Knowing FFMI and using the charts below will help determine what percentile rank an individual falls in. This can help with goal setting: Should I focus on increasing muscle mass as a part of my strategy for body composition change? Am I approaching the upper limit of FFMI to a point where significant increase in muscle mass may not be possible?
How to calculate FFMI
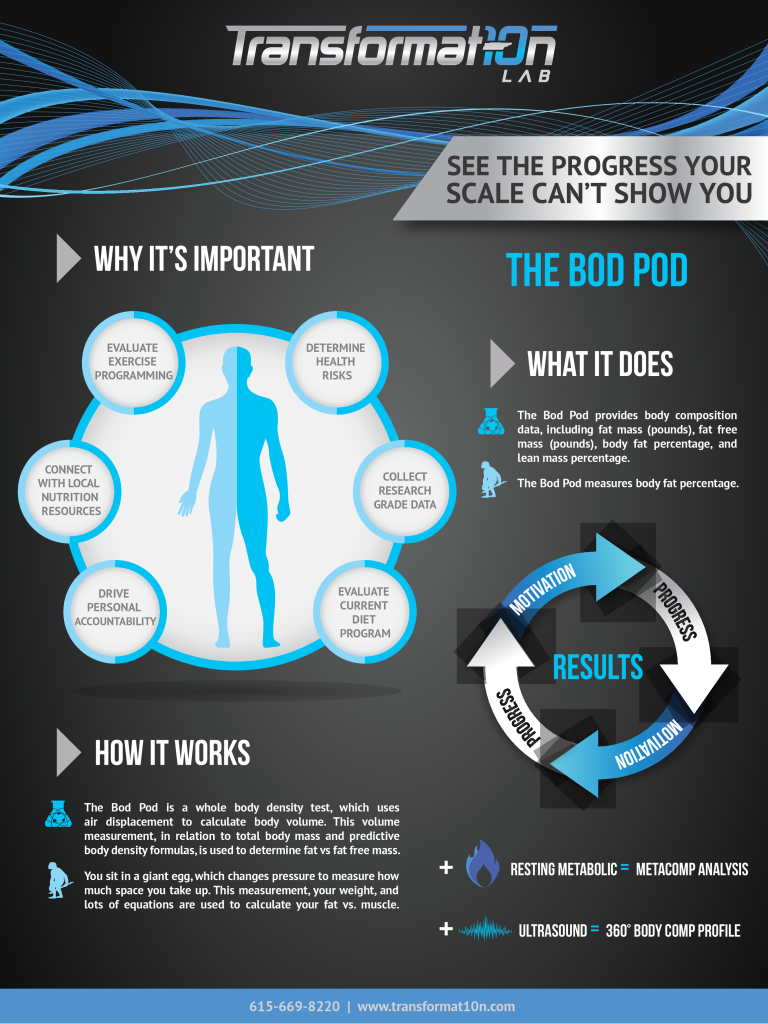
In order to calculate FFMI you’ll need to have an accurate assessment of your body fat percentage. Once that is obtained, use the formula below:

Let’s look at an individual that is 68 inches tall, 165 pounds, and has a body fat percentage of 24%. This individual has a fat free (lean) percentage of 76% (100% – 24% fat mass) and therefore a lean body mass of .76 x 165 = 125.4 lbs.
First, convert to metric:
- 125.4 lbs = 56.88 kg
- 68 in = 1.73 m
Then, enjoy an exponent and some division:
- 1.73 m2 =1.73 x 1.73 = 2.993
- 56.88/2.993 = 19.0
This example individual has a FFMI of 19.0. There are several FFMI calculators on the internet if you prefer to avoid the math.
What is the relationship between FFMI and BMI?
BMI, or Body Mass Index, is widely used in health and medicine as a way to categorize individuals as underweight, healthy, overweight or obese. It follows a similar calculation to FFMI, except it uses total body mass (body weight in kg) divided by height (in meters squared).
The well-known downside to BMI is that it does not distinguish between fat and fat free tissue, and treats every pound the same. As a result, lean individuals with a high FFMI are likely to be categorized as overweight or even obese on the BMI chart. On the flip side, a high body fat individual with low FFMI (layman’s term: skinny-fat) may still categorize as normal or healthy on the BMI chart.
What are normal FFMI ranges for women and men?
One of the largest studies done using a reputable body composition assessment method was this Italian study which sampled almost 2,000 adults to establish reference values for FFMI. Keep in mind, this was a predominantly Caucasian population, and we’ll look at potential differences in ethnicity/race in the next section.
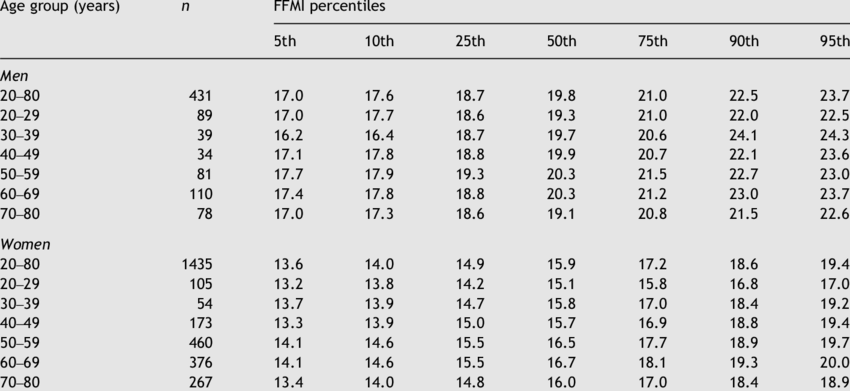
These values were similar to another 5,000 person study published in the International Journal of Obesity that used an even larger age range of 18-98 years (again Caucasian Europeans).
With this in mind, men with a FFMI below 18 and women with a FFMI of less than 14.5 may be at higher risk for the consequences of sarcopenia, age-related muscle loss. On the opposite end of the spectrum, men with a FFMI over 22 and women with a FFMI over 18.5 may find that BMI does not provide an accurate depiction of their health or ideal weight range.
Are there race/ethnic differences in FFMI norms?
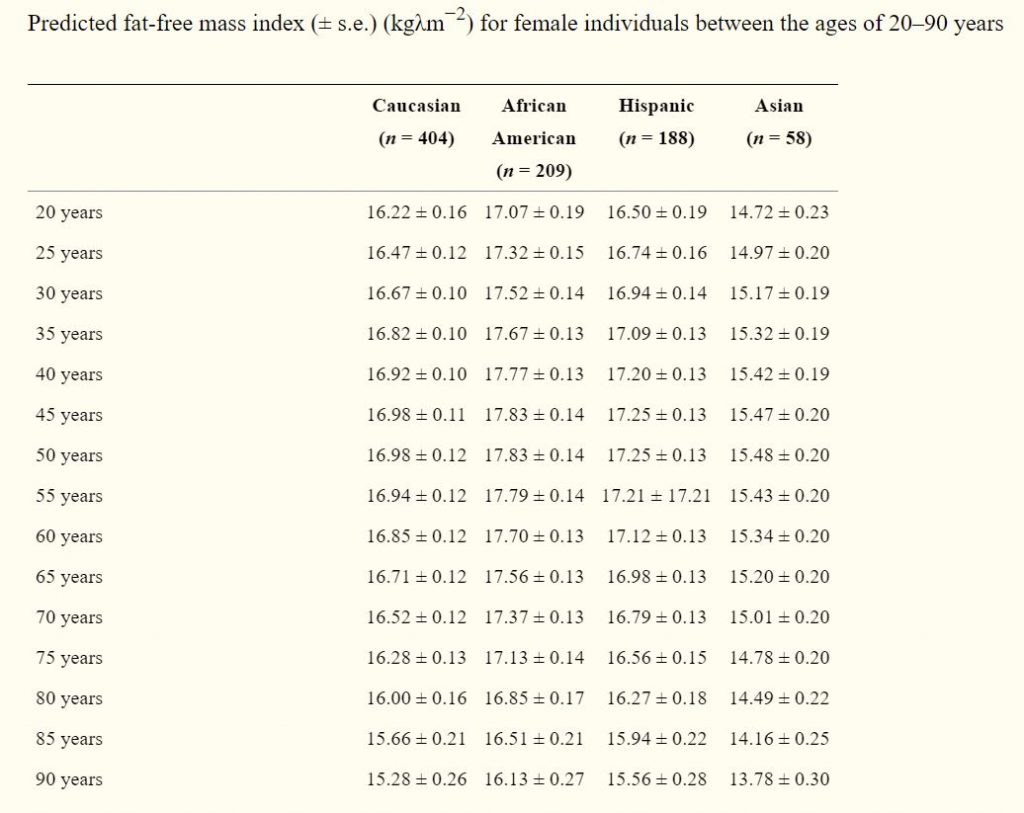
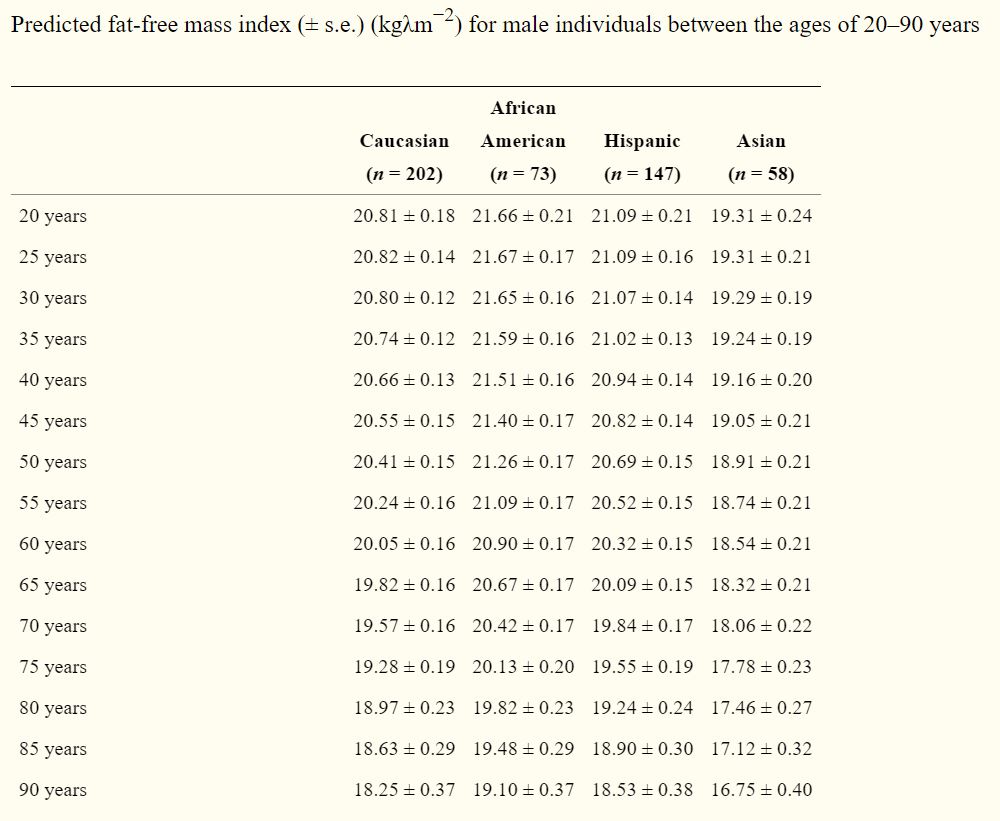
Based on the results of this US-based study , FFMI was greatest in the African American group and lowest in the Asian group for each gender and age range. In the middle were Caucasian and Hispanic groups:
Is there an upper limit FFMI for natural or drug-free individuals?
A large amount of public discussion around FFMI is centered on whether there is a maximum value for drug-free individuals. Given the lack of research on female athletes – particularly steroid users – we are going to focus on male numbers for this discussion. Take a quick glance around web and you’ll find many sites suggesting that 25 is the FFMI upper limit for men, and men who have a FFMI greater than 25 must be using steroids.
This 1995 study is often the reference point for those that declare 25 to be the upper cutoff for FFMI without the use of performance enhancing drugs. At first glance, the study seems pretty straightforward. They examined 157 ‘athletes’ and found that of the 74 that had never used steroids, all had an FFMI less than 25. In addition, of the 83 that had used steroids, FFMI values greater than 25 were common. Greg Nuckols does a nice critique of this study, noting some key limitations including the lax inclusion criteria (only requiring participants to have weight trained for two years and be at least 16 years old), as well as the low total sample size.
This more recent study, in the Journal of Strength and Conditioning Research, was done on NCAA Division I and Division II football players. Over one quarter of the participants (26.4%) had a FFMI over 25, and six individuals (2.5% of players studied) had a FFMI greater than 28.1. The authors suggested 28 as a more practical upper limit for most college football players given the small percentage exceeding this FFMI.
These values reflect our experience at the Transformat10n Lab as we have tested a handful of elite collegiate players in preparation for the NFL Scouting Combine, and found that FFMI values of 25-28 are not only possible, but occur with regularity among this population.
Given the drug testing program at the collegiate level, and the relatively large sample size, this data would refute the notion that 25 serves as the absolute upper limit FFMI for drug-free men. In fact, there is a strong likelihood that at least a few of the small percentage of men that have a measured FFMI over 30 are also drug-free.
Keep in mind, when analyzing high level college football players we’re talking about less than 1% of the most elite athletes in a sport where lean body mass is a key characteristic for success. Even for die-hard gym goers, a drug-free FFMI of 24-25 would not only be an incredible accomplishment, it could easily be 10-15+ years worth of training and eating to build muscle mass.
In conclusion, the concept of 25 as a FFMI hard upper limit among drug-free men is not valid, but exceeding that value without steroids is rare for the general population. Some elite strength and power athletes will exceed this threshold while remaining drug free. Individuals with high body fat percentage have a greater likelihood of exceeding as they generally carry more non-muscle fat free mass (water, glycogen, etc.) than leaner individuals with a similar muscle mass. More research is needed, particularly among the female demographic.

